Data Reporting | Web Scraping Tool | ScrapeStorm
Abstract:Data reporting is a format that visualizes collected and processed data and presents analysis results and trends in an organized manner. ScrapeStormFree Download
ScrapeStorm is a powerful, no-programming, easy-to-use artificial intelligence web scraping tool.
Introduction
Data reporting is a format that visualizes collected and processed data and presents analysis results and trends in an organized manner. It is mainly used in business intelligence (BI) and data analysis tools to convey information in an easy-to-understand way in visual formats such as graphs, tables, and dashboards. Data reporting is an important tool to help decision makers and stakeholders make data-driven decisions.
Applicable Scene
It visualizes sales data, customer behavior, marketing results, etc., helping executives and employees make quick decisions. Financial status such as profit and loss statement (P/L), balance sheet (B/S), cash flow, etc. are displayed in the form of reports, so that the company’s health can be seen at a glance. Evaluate and optimize the activities of the sales team by reporting sales performance and sales trends. Customer purchase history and behavior patterns are visualized and used for positioning measures.
Pros: By visually presenting complex data, you can spot trends and outliers in the data at a glance. Dashboard reports that reflect real-time data help make decisions quickly. The automatic generation function of BI tools reduces manual work and makes regular report creation more efficient. Reports can be flexibly customized based on specific indicators and KPIs, allowing you to provide information that meets your needs. You can go beyond surface-level reports and dig deeper into the details.
Cons: Since reports are based on raw data, incorrect conclusions may be drawn if the data is less accurate or reliable. Displaying too many charts and indicators reduces visibility and weakens the effectiveness of the report. Creating reports using BI tools and cloud services is very convenient, but there are implementation and maintenance costs. Some reports are updated regularly and may not reflect real-time data. Complex report creation and data analysis require professional skills.
Legend
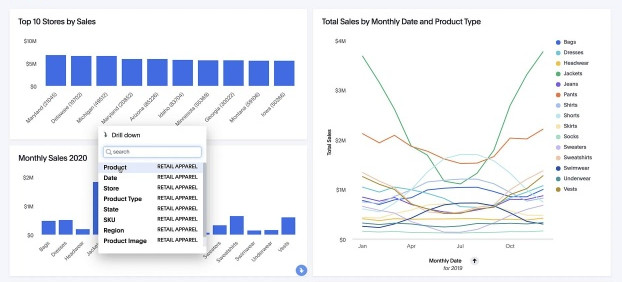
1. Data reporting.
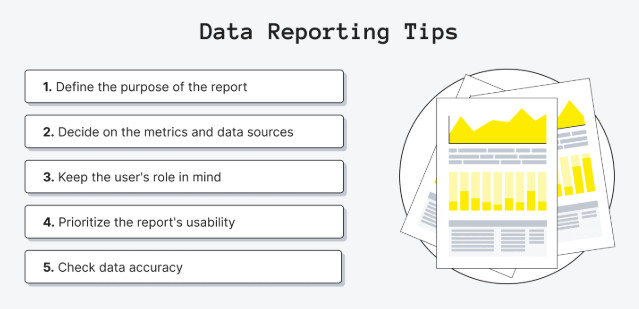
2. Data reporting tips.
Related Article
Reference Link
https://en.wikipedia.org/wiki/Data_reporting
https://www.coursera.org/articles/data-reporting
https://www.thoughtspot.com/data-trends/analytics/data-reporting